Introduction
In today’s interconnected digital environment, slow internet, packet loss, and unexpected network delays can seriously affect productivity, gaming, streaming, and business operations. One of the most powerful yet often overlooked tools for diagnosing these issues is the Trace Route Tool. This tool allows users to track the exact path data packets take from their device to a destination server, revealing where delays or failures occur along the way.
Unlike basic speed tests that only show upload or download performance, a trace route tool provides deep insight into the structure of the network itself. It identifies each hop—routers and servers—that data passes through and measures the time taken at every step. This makes it invaluable for network administrators, IT professionals, developers, and even regular users who want to understand why a website loads slowly or why a connection keeps timing out.
This comprehensive guide explains what a trace route tool is, how it works, why it matters, and how to use it effectively. Based on real-world networking experience and best practices, this article will help you diagnose connectivity problems accurately and make informed decisions to improve network performance.
What Is a Trace Route Tool?
A trace route tool is a network diagnostic utility used to map the journey of data packets from a source device to a target destination, such as a website or server. It shows each intermediate node, known as a hop, that the packet travels through and measures the response time for each hop.
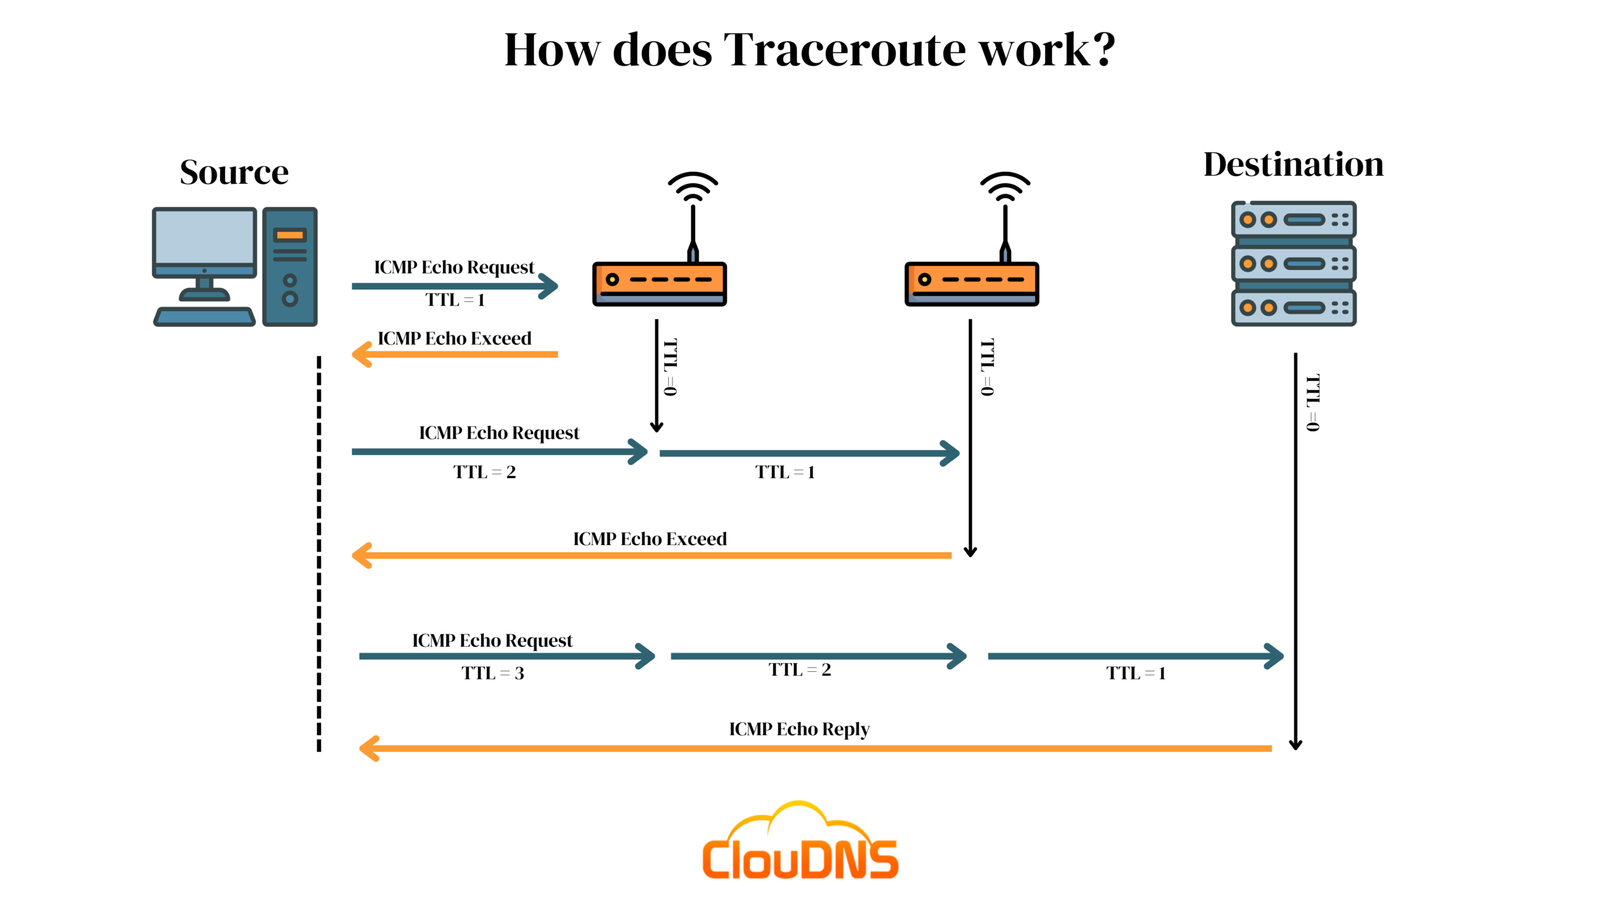
The tool works by sending packets with gradually increasing time-to-live (TTL) values. Each router that receives the packet decreases the TTL by one. When the TTL reaches zero, the router sends a response back to the source, allowing the tool to record that hop.
Why Trace Route Matters
The trace route tool helps identify:
- Network congestion points
- Routing loops or failures
- High-latency hops
- ISP or server-side issues
- Packet loss locations
For example, if a website is slow but your internet speed is normal, a trace route tool can reveal whether the delay is caused by your ISP, an international gateway, or the destination server.
How a Trace Route Tool Works
Understanding how a route tool functions builds trust in the results and helps users interpret data correctly.
Step-by-Step Process
- The tool sends a data packet with a low TTL value.
- The first router responds when TTL expires.
- The TTL value increases with each packet sent.
- Each responding router is recorded as a hop.
- The process continues until the destination server responds.
The output usually includes the IP address or hostname of each hop and the round-trip time in milliseconds. High response times or missing responses indicate potential problems.
Real-World Example
If an online game server experiences lag, running a trace can show whether latency spikes occur near your local network, your ISP backbone, or the international routing path.
Common Uses of a Trace Route Tool
The trace route tool is widely used in both professional and personal networking scenarios.
Practical Applications
- Troubleshooting slow websites
- Diagnosing packet loss issues
- Verifying ISP routing efficiency
- Identifying firewall or security blocks
- Monitoring server accessibility
Network engineers rely on trace route results to communicate effectively with ISPs and hosting providers, backed by measurable data.
Trace Route Tool on Different Operating Systems
Most operating systems include a built-in trace route tool, though the command name may differ.
Popular Commands
- Windows: tracert
- Linux: traceroute
- macOS: traceroute
Online trace route tools are also available for users who prefer browser-based testing without command-line access.
How to Use a Trace Route Tool Effectively
Running a trace route tool correctly ensures accurate and meaningful results.
Best Practices
- Use reliable destination servers
- Run tests multiple times
- Compare results from different locations
- Record timestamps and hop delays
- Combine results with ping tests
These practices improve diagnostic accuracy and help isolate intermittent issues.
Interpreting Trace Route Results
Understanding output data is crucial for problem-solving.
Key Indicators
- High latency on early hops: local network issues
- Sudden spikes mid-route: ISP or regional routing problems
- Timeouts near destination: server-side or firewall restrictions
Not all timeouts indicate failure, as some routers block trace route responses for security reasons.
Limitations of Trace Route Tools
While powerful, trace route tools have limitations.
Common Limitations
- ICMP packet blocking
- Load-balanced routing paths
- Incomplete hop responses
Despite these limitations, trace route remains one of the most reliable tools for network path analysis.
Conclusion
The Trace Route Tool is an essential diagnostic utility for understanding how data travels across the internet. By revealing each network hop and measuring latency, it empowers users to pinpoint connectivity issues with precision. Whether you are troubleshooting slow websites, diagnosing packet loss, or communicating with an ISP, trace route testing provides clarity and confidence. Regular use of this tool improves network awareness, reliability, and overall internet performance in both personal and professional environments.
FAQs
1. What does a trace route tool do?
It shows the path and delay of data packets between your device and a destination.
2. Is trace route safe to use?
Yes, it is a read-only diagnostic tool and does not harm networks.
3. Why do some hops show timeouts?
Some routers block responses for security reasons.
4. Can trace route fix network problems?
It identifies issues but does not directly fix them.
5. Should beginners use trace route tools?
Yes, basic use is simple and very helpful.